Prometheus Survey
Prometheus Survey
Architecture
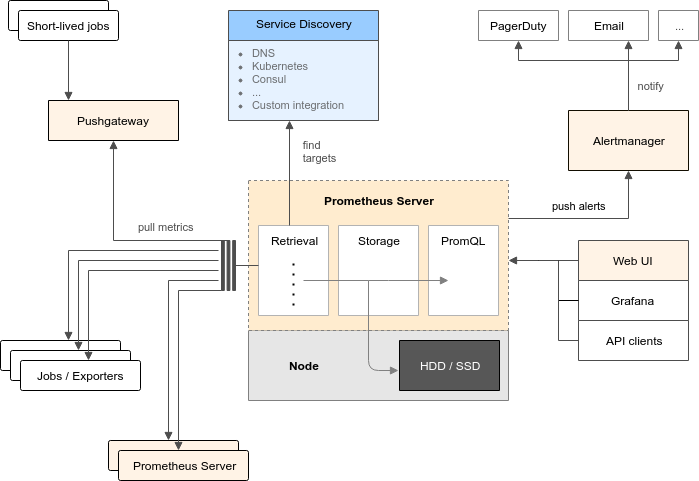
Prometheus server
負責蒐集及儲存各 target 的 metrics,也會檢查 alert 規則,觸發後會發 alert 給 alertmanager。
Target
要被監控的目標,會以網頁方式將 metrics 以固定格式呈現給 prometheus server 抓取。
Pushgateway:
若有一些 target 不適合以抓取的方式獲得 metrics,例如存活時間很短的 job,prometheus server 還來不及抓就關閉了,則可以將 metrics 推送到 pushgateway,再讓 prometheus server 到 pushgateway 抓取 metrics。
Alertmanager:
prometheus server 會檢查 alert 規則,將觸發的 alert 送到 alertmanager,而 alertmanager 會將 alert 整理後,確定可以發出才會將 alert 送往設定的 receiver。
Concepts
Data Model
- 每一條 time series 由 metric name 及一組 labels 來辨別。
- Metric name 必須符合此 regular expression:
[a-zA-Z_:][a-zA-Z0-9_:]-。 - Labels 使 Prometheus 可以有多維度的資料,對任何 label 值變動,都會產生一條新的 time series。
- Labels 必須符合此 regular expression:
[a-zA-Z_][a-zA-Z0-9_]-。 - 開頭是 __ 的 label 是預留給內部使用的。
- Label 值可以使用任何 unicode 字元。
- 每一個採樣點是:
- 一個 float64 值
- millisecond 等級的 timestamp
- Metric name 及 labels 用法
<metric name>{<label name>=<label value>, ...}- Example:
api_http_requests_total{method="POST", handler="/messages"}
Metric Types
Prometheus 的 client libraries 提供了四種核心 metric types:
-
Counter: 一個 counter 是累加的 metric,此數值只會單調遞增。Counter 不應用在會隨時增加或減少的 metric 上,此情形應該使用 gauge。
-
Gauge: 一個 gauge 是表示可以隨時上升或下降的 metric 數值。
-
Histogram: 一個 histogram 會計算 metric 的分佈,分佈的細粒度是可控制的。Histogram 會產生多個 time series,開頭會以 metric name 作為 prefix,例如:
- 某個區間的分佈:
<basename>_bucket{le="<upper inclusive bound>"} - 所有觀察到的數據總合:
<basename>_sum - 所有觀察到的數據總數:
<basename>_count(i.e.<basename>_bucket{le="+Inf"})
- 某個區間的分佈:
-
Summary: 與 histogram 非常相似,差異在於 summary 是在 client side 即時計算百分位數,而 histogram 是在 server side 利用分好的數據計算。Summary 會產生多個 time series,開頭以 metric name 作為 prefix,例如:
- 百分位數:
<basename>{quantile="<φ>"} - 所有觀察到的數據總合:
<basename>_sum - 所有觀察到的數據總數:
<basename>_count
- 百分位數:
Jobs and Instances
- 在 Prometheus 裡,每一個你能抓取數據的就稱為 instance。
- 一群有著相同目的 instances 就稱為 job。
- 例如一個 API server job,有四個 replica instances:
- job: api-server
- instance 1:
1.2.3.4:5670 - instance 2:
1.2.3.4:5671 - instance 3:
5.6.7.8:5670 - instance 4:
5.6.7.8:5671
- instance 1:
- job: api-server
- Prometheus 抓取數據時,會自動產生一些 labels:
- job:被抓取的目標是屬於哪個 job。
- instance:被抓取的目標的 URL,例如:
<host>:<port>
Storage
Local Storage
- 每兩小時採樣點會被 group 成一個 block,每一個 block 會位在一個資料夾底下
- 資料夾裡有一或多個 chunk files,這些 chunk files 包含這兩小時內所有的 time series 採樣點。
- 同時也會有 metadata file 及 index file,用來 index metric names 及 labels。
- 採用 write-ahead-log (WAL) 機制,應付 server 突然掛掉的情形
- 透過 API 刪除 time series 時,被刪除的資料會先存在另外的地方 (tombstone),而不是馬上把資料刪掉。
- Local storage 不是 clustered 也不是 replicated,所以無法隨意擴充。
Operational Aspects
- Prometheus 透過下列幾個 flags 來設定 local storage,比較重要的有:
--storage.tsdb.path:決定 Prometheus 的 database 位置,預設是 data/。--storage.tsdb.retention:決定資料要保存多久,預設是 15d。
- Prometheus 平均一個採樣點是 1 - 2 個 bytes,所以計算使用量可以簡單用底下公式:
needed_disk_space = retention_time_seconds - ingested_samples_per_second - bytes_per_sample - 想要把 ingested_samples_per_second 降低,可以減少抓取的 time series 數量或是拉長抓取間隔時間,但透過減少 time series 數量是比較有效率的,因為壓縮效率會更好。
- 如果你的 local storage 不幸損壞了,可以試著單獨移除 block 資料夾,這也代表著大約有兩小時的資料無法復原。
- 請注意,Prometheus 的 local storage 不保證長期儲存資料。
Remote Storage Integrations
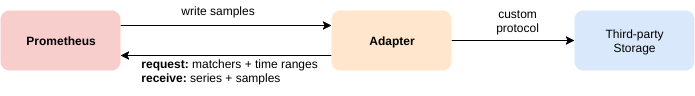
- Prometheus 的擴展性、耐用性並不好,所以提供了一些介面讓你可以與外部長期儲存系統整合。
- Prometheus 與外部儲存空間整合利用底下兩種方式 (如上圖):
- Prometheus can write samples that it ingests to a remote URL in a standardized format.
- Prometheus can read (back) sample data from a remote URL in a standardized format.
- 讀寫的 protocol 都是用 snappy 壓縮,再透過 HTTP 傳輸。
- 這個 protocol 並不是很穩定,未來可能在 HTTP/2 上用 gRPC。
Query
Expression Data Types
- Instant vector: 一組時間序列,每條時間序列只含最新的數據。
- Range vector: 一組時間序列,每條時間序列含有過去 x 時間的數據。
- Scalar: 一個浮點數
- String: 一個字串值,目前並沒有使用
Time Series Selectors
Instant vector selectors
選取一組時間序列,並回傳最新的數據,可以加上 label 來過濾特定的時間序列。例如:
http_requests_total所有在這條時間序列的 metrics 都會被回傳http_requests_total{job="prometheus",group="canary"}只會回傳有這兩個 labels 的數據
可以搭配等式來找出吻合的 label 或反向不吻合的 label,例如:
=:過濾出完全符合字串的 labels!=:過濾出不符合字串的 labels=~:過濾出符合 regex 的 labels (Prometheus 採用 RE2 syntax)!~:過濾出不符合 regex 的 labels
底下舉例上述四種用法:
http_requests_total{job="web",env--_=_--"production"}http_requests_total{job="web",status_code--_!=_--"200"}http_requests_total{job="web",status_code--=~--"200|304"}http_requests_total{job="web",path--_!~_--"/ec/x/.-"}
Range vector selectors
與 instant vector selectors 很類似,只不過 range vector selectors 會回傳指定時間長度的數據。例如:
http_requests_total{job="web"}[5m]http_requests_total{job="web"}[1h]
時間長度以一個數字加上一個單位組成,例如:
s:秒m:分h:時d:日w:週y:年
Offset modifier
Offset modifier 會根據目前 query 的時間往前位移指定時間,例如:
http_requests_total offset 5m會回傳 5 分鐘前的數據rate(http_requests_total[5m] offset 1w)會回傳一星期前 5 分鐘的速率
請注意 offset modifier 需要緊接在 selector 後面,例如:
sum(http_requests_total{method="GET"} offset 5m) GOODsum(http_requests_total{method="GET"}) offset 5m INVALID
Binary Operators
Arithmetic binary operators
二元算術運算有下列幾個:
+:加法-:減法-:乘法/:除法%:餘數^:指數
二元算術運算可以運算在下列 data type:
scalar/scalar=>scalarvector/scalar=>vectorvector/vector=>vector
Comparison binary operators
二元比較運算有下列幾個:
==:等於!=:不等於>:大於<:小於>=:大於等於<=:小於等於
二元比較運算可以運算在下列 data type:
scalar/scalar=> bool 0 (false) or 1 (true)vector/scalarvector/vector
Logical/set binary operators
邏輯/集合二元運算有下列幾個:
and:交集or:聯集unless:差集
邏輯/集合二元運算只能用在 instant vector 上,例如底下運算:
- vector1
andvector2 會回傳在 vector1 也在 vector2 的元素並且 label sets 要一樣,metric 名稱及數據會從左手邊的 vector 獲得 - vector1
orvector2 會回傳所有在 vector1 的元素 (label sets + values),再加上所有不符合 vector1 label sets 的 vector2 元素 - vector1
unlessvector2 回傳所有在 vector1 的元素,但符合 vector2 label sets 的元素會被丟掉
Vector Matching
One-to-one vector matches
如果有完全一模一樣的 set of labels 跟相對應的值,則稱這兩個 entries 相符,底下兩個 keyword 可以過濾指定 labels:
ignoring:指定忽略哪些相符 labelson:只考濾指定的 labels
使用方法:
<vector expr> <bin-op> ignoring(<label list>) <vector expr><vector expr> <bin-op> on(<label list>) <vector expr>
Example input:
method_code:http_errors:rate5m{method="get", code="500"} 24method_code:http_errors:rate5m{method="get", code="404"} 30method_code:http_errors:rate5m{method="put", code="501"} 3method_code:http_errors:rate5m{method="post", code="500"} 6method_code:http_errors:rate5m{method="post", code="404"} 21method:http_requests:rate5m{method="get"} 600method:http_requests:rate5m{method="del"} 34method:http_requests:rate5m{method="post"} 120
Example query:
method_code:http_errors:rate5m{code="500"} / ignoring(code) method:http_requests:rate5m
如果不使用 ignoring(code) 則不會有任何結果,因為沒有完全一樣的 set of labels。put 跟 del 沒有相符的 label 所以不會出現在結果裡。
Result:
{method="get"} 0.04 // 24 / 600{method="post"} 0.05 // 6 / 120
Many-to-one and one-to-many vector matches
使用方法:
<vector expr> <bin-op> ignoring(<label list>) group_left(<label list>) <vector expr><vector expr> <bin-op> ignoring(<label list>) group_right(<label list>) <vector expr><vector expr> <bin-op> on(<label list>) group_left(<label list>) <vector expr><vector expr> <bin-op> on(<label list>) group_right(<label list>) <vector expr>
Example query:
method_code:http_errors:rate5m / ignoring(code) group_left method:http_requests:rate5m
Result:
{method="get", code="500"} 0.04 // 24 / 600{method="get", code="404"} 0.05 // 30 / 600{method="post", code="500"} 0.05 // 6 / 120{method="post", code="404"} 0.175 // 21 / 120
Aggregation Operators
Prometheus 內建下列 aggregation 操作:
sum:所有維度總和min:找出所有維度裡最小值max:找出所有維度裡最大值avg:所有維度平均值stddev:所有維度標準差stdvar:所有維度標準變異量count:計算該 vector 裡有多少元素數量count_values:計算有多少元素是有相同值bottomk:從 sample value 找出最小 k 個元素topk:從 sample value 找出最大 k 個元素quantile:從所有維度計算 φ-quantile (0 ≤ φ ≤ 1)
這些 aggregation 操作可以透過 without 或是 by 來指定要使用的 labels,使用方法為:
<aggr-op>([parameter,] <vector expression>) [without|by (<label list>)]
例如:sum(http_requests_errors) by (code)
parameter 只有下列操作需要:count_values、quantile、topk、bottomk
Example:
- 如果有一 metric
http_requests_total,他有三個 lables 為application、instance及group,則我們可以分別計算 application 及 group 的 HTTP requests 總和,下列兩個 query 是等價的:sum(http_requests_total) without (instance)sum(http_requests_total) by (application, group)
- 如果我們只在意所有的 HTTP requests 總和:
sum(http_requests_total) - 想計算不同版本各有多少 binaries 在執行:
count_values("version", build_version) - 想計算所有機器裡收到 HTTP requests 的前 5 名:
topk(5, http_requests_total)
Binary Operator Precedence
下列為 Prometheus 二元運算的優先權,由高到低為:
^-,/,%+,-==,!=,<=,<,>=,>and,unlessor
有相同優先權的運算子則為左結合律,然而 ^ 則是右結合律,例如:
2 - 3 % 2則等價於(2 - 3) % 22 ^ 3 ^ 2則等價於2 ^ (3 ^ 2)
Functions
由於數量過多,儘說明下列兩項:
-
rate()rate(v range-vector)計算每秒平均速率。單調函數若有中斷 (例如 counter resets) 則會自動調整。此外,若抓取數據時有失誤,也會自動對齊抓取的週期。- 過去 5 分鐘 HTTP requests 每秒的速率:
rate(http_requests_total{job="api-server"}[5m]) - 當結合
rate()與 aggregation 操作使用時,必須先計算rate()再使用 aggregation,否則當 counter 被 resets 時,rate()無法偵測到。
-
irate()irate(v range-vector)計算每秒即時速率。
Alerting
Grouping
Grouping 將類似的警告分類在一起,並且只送出一個警告訊息。在許多系統同時出問題時非常有用。
例如:某個服務裡有一半的 instances 無法連到資料庫時,同時會有許多警告送到 Altermanager。使用者希望只收到一則警告訊息,卻同時還能看出是哪幾台 instances 受到影響,此時便可以設定 Alertmanager 將這些警告訊息根據他們的 alertname 及 cluster group 在一起。
Inhibition
Inhibition 的概念是:如果有特定警告已經發出了,將有其他的警告會被禁止發出。
例如:有警告通知有一整個 cluster 無法連接。Alertmanager 可以設定禁止其他與此 cluster 相關的警告持續發出。
Silences
Silences 就是將警告關閉一段時間。silence 透過 matchers 來判斷警告是否要發出。當有一個警告送來時,會檢查是否符合所有的檢查式,或是 regular expression。若符合則不會發出任何警告。
Configuration
# The root route with all parameters, which are inherited by the child
# routes if they are not overwritten.
route:
  receiver: 'default-receiver'
  group_wait: 30s
  group_interval: 5m
  repeat_interval: 4h
  group_by: [cluster, alertname]
  # All alerts that do not match the following child routes
  # will remain at the root node and be dispatched to 'default-receiver'.
  routes:
  # All alerts with service=mysql or service=cassandra
  # are dispatched to the database pager.
  - receiver: 'database-pager'
    group_wait: 10s
    match_re:
      service: mysql|cassandra
  # All alerts with the team=frontend label match this sub-route.
  # They are grouped by product and environment rather than cluster
  # and alertname.
  - receiver: 'frontend-pager'
    group_by: [product, environment]
    match:
      team: frontend
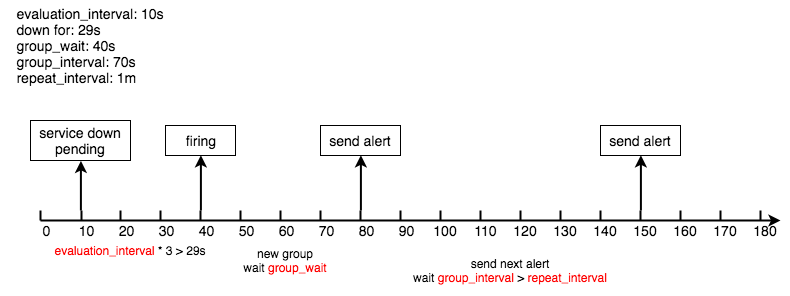
Alerting Flow
-
接收到Alert,根据labels判断属于哪些Route(可存在多个Route,一个Route有多个Group,一个Group有多个Alert)
-
将Alert分配到Group中,没有则新建Group
-
新的Group等待group_wait指定的时间(等待时可能收到同一Group的Alert),根据resolve_timeout判断Alert是否解决,然后发送通知
-
已有的Group等待group_interval指定的时间,判断Alert是否解决,当上次发送通知到现在的间隔大于repeat_interval或者Group有更新时会发送通知
Example: given the service never up
Best Practices
Metric and Label Naming
Metric Names
- 應該要有一個字的 prefix,指出該 metrics 是屬於哪個應用的,例如:
prometheus_notifications_total 指出是 Prometheus serverprocess_cpu_seconds_total 指出是由許多 client libraries export 出來的http_request_duration_seconds 指出是全部的 HTTP requests
- 一定只能有一個單位,也就是不要混用 seconds 跟 milliseconds,或是 seconds 跟 bytes。
- 應該用基本單位,也就是用 seconds, bytes, meters,不要用 milliseconds, megebytes (見下方 base units)。
- 應該要有複數形式的單位作為 suffix,若是累加請用 total,例如:
- http_request_duration_
seconds - node_memory_usage_
bytes - http_requests_
total(沒有單位的累加) - process_cpu_
seconds_total(有單位的累加)
- http_request_duration_
Labels
- 使用 label 來區分同一個 metric 中不同特性:
api_http_requests_total區分不同 request types:type="create|update|delete"api_request_duration_seconds區分不同 reqeust stages:stage="extract|transform|load"
- 不要把 label 名稱放到 metrics 裡,一來沒有用,而且在 aggregate 時會混亂。
- 記住任何唯一的 key-value label pairs 都會產生一條新的 time series,這會讓儲存空間迅速成長。
Instrumentation
為了監控的話,服務可大致上分為三類:online-serving, offline-processing, batch jobs。 這三類會有一些交集,但每個服務會傾向落在某一類上。
Online-serving Systems
- 線上服務系統是被期待要能馬上回應的,像是 database、HTTP 請求。
- 主要 metrics 有:
- number of performed queries
- errors
- latency
- number of in-progress requests
- 線上服務系統需要監控 client 及 server,如果兩邊的行為不太一致,那在找問題時會非常有用。
- 如果 client 有很多個,那就無法由服務本身監控,得依賴他們自己的數據。
- 在計算 queries 數量時,要統一開始就計數,還是結束才計數。結束後才計數是比較建議的,因為同時會累加 error 及 latency。
Offline Processing
- Offline processing 可能會分成多個階段處理。
- 追蹤每一階段進來的東西、有多少正在處理、最後處理完的時間、有多少東西送出去。
- 如果這個系統卡住的話,知道最後一個處理完的時間是很有用的,但這個資訊是非常局部的。
- 較好的方法是送出一個假的東西,讓他帶著 timestamp 通過整個系統。
- 每一個階段可以回報他們最後看到心跳的 timestamp。
Batch Jobs
- Batch jobs 與 offline-processing 的界線很難分清楚。
- 主要關心的 metrics 有:
- 最後成功的時間
- 每一個主要階段花了多久
- 總共花的時間
- 最後完成的 job 時間 (成功或失敗都算)
- 需要花幾分鐘跑的 batch jobs 很適合用拉取的方式監控,同時可以監控其他資源,在 job 開始變慢時是很有用的資訊。
- 對於執行頻率很高的 job (例如 15 分鐘內),可以考慮將之轉成 daemons 的形式,並用 offline-processing 來處理 jobs。
Subsystems
-
Libraries
- Libraries 應該提供偵測,使用者無需設置。
- 如果會 library 會使用外部資源 (network, disk, IPC),至少要監控 query count, errors, latency。
-
Logging
- 用 counter 計算 logging code 的行數,如果發現有趣的 log message,可能會想知道這有多常出現及持續多久。
- 如果有非常接近的 log message (branches of if, switch),用單一個 counter 紀錄他們是合理的。
- 分別紀錄有幾行 info/error/warning 也會很有用。
-
Failures
- 每一次發生 failure 時,相對應的 counter 就要增加。
- 不像 logging,error 發生時可能要浮到更上層的 error counter。
- 當回報 failures 時,應該要一起回報嘗試的次數,這讓 failure ratio 比較容易計算。
-
Threadpools
主要 metrics 有:- number of queued requests
- number of threads in use
- total number of threads
- number of tasks processed
- how long they took
- how long things were waiting in the queue
-
Caches
主要 metrics 有:- total queries
- hits
- overall latency
- query count
- erros
- latency of whatever online-serving system the cache is in front of
Things to Watch Out For
- Use labels
- 當你想 add/average/sum 多條 metrics 時,他們應該是一條 metric 帶著 labels,而不是多條 metrics。
- 例如:與其使用
http_responses_500_total及http_responses_403_total,你應該使用http_responses_total並用 code 當作 label 來區分 HTTP response code。
- Do not overuse labels
- 每一組 labelset 都是一條新的 time series,都會造成 RAM, CPU, disk, network 的負擔。
- 通常我們會建議把 cardinality 控制在 10 以下。
- 大部份的 metrics 應該要沒有 labels。
- 如果有 metric 的 cardinality 超過 100 或是有潛力超過 100,建議試著減少或是乾脆從 monitoring 中移走,移到更適合的地方。
- 以 node exporter 為例,每一個 node 會產生 10 幾條 time series,如果你有 10,000 個 nodes,你最終會有 100,000 條 time series,但這對 Prometheus 來說是可以掌控的。
- 如果你不確定,從完全沒有 labels 開始,再隨著需求增加。
- Counter vs. gauge
- 如果有個數值會減少,那就用 gauge。
- Counter 只能往上增加,搭配 rate() 可以算出每秒速率。
- Gauge 可以往上往下,這像是在 snapshot 狀態,千萬不要用 rate() 算一個 gauge。
- Timestamps, not time since
- If you want to track the amount of time since something happened, export the Unix timestamp at which it happened - not the time since it happened.
- With the timestamp exported, you can use the expression time() - my_timestamp_metric to calculate the time since the event, removing the need for update logic and protecting you against the update logic getting stuck.
- Inner loops
- 監控帶來的好處遠大於所花的資源。
- 如果你的系統真的對效能很要求,限制你更新 metrics 的數量,並且避免 labels。
- 一個 Java counter 大概花 12 - 17 ns 在更新,其他語言也會有差不多的效能。
- Avoid missing metrics
- 當 time series 消失時,會很難處理,通常簡單回報 0 是個方法 (如果回 0 會造成誤會,就回報 NaN )。
- 大部份的 Prometheus client libraries 都會自動回 0。
Histograms and Summaries
Library support
- Golang, Java, Python, Ruby 都支援 histograms 及 summaries。
- 如果你的 SLA 是 95% requests 都要在 300ms 內,你可以用底下 expression 來設定 alert:
sum(rate(http_request_duration_seconds_bucket{le="0.3"}[5m])) by (job)
/
sum(rate(http_request_duration_seconds_count[5m])) by (job)
- 也可以透過 Apdex score 來計算,除了目標外,會再設定一個可忍受的範圍 (通常是目標的 4 倍):
(sum(rate(http_request_duration_seconds_bucket{le="0.3"}[5m])) by (job)
+
sum(rate(http_request_duration_seconds_bucket{le="1.2"}[5m])) by (job))
/ 2 / sum(rate(http_request_duration_seconds_count[5m])) by (job)
Quantiles
- 你可以用 summaries 及 histograms 來計算百分位數。
- Summaries 及 histograms 最主要的差別是:
- Summaries 在 client side 即時計算百分位數
- Histograms 是在 server side 用 histogram_qualtile() function 從分好的 observation counts 計算。
- 此表列出兩者差異
- 如果服務有多個 instance,不能 aggregate 預先計算好的百分位數,這在統計上是沒有意義的,例如:
avg(http_request_duration_seconds{quantile="0.95"}) // BAD! - 改為利用分佈圖就可以了,例如:
histogram_quantile(0.95, sum(rate(http_request_duration_seconds_bucket[5m])) by (le)) // GOOD. - 用上述方法還有一個好處是,如果 SLA 條件改了,你要看第 90 百分位數或是要看過去 10 分鐘,你只需要改上面的 expression,不需要重新設定 client。
Errors of quantile estimation
- 總結:
- 如果你用 summary,你藉由控制百分位數的維度來控制誤差。
- 如果你用 histogram,你藉由控制觀察結果(選擇適當的 bucket) 來控制誤差。
- 較廣的分佈,小小的改變百分位數在觀察結果就會有很大的誤差。
- 較集中的分佈,小小的區間裡,就會涵蓋大區間的百分位數。
- 建議:
- 如果你需要 aggregate 就使用 histograms。
- 否則:
- 如果你知道數值大概會怎麼分佈,就使用 histogram。
- 如果不管數值會怎麼分佈,你就是需要精準的百分位數,就使用 summary。
- 不論是在 client-side 或是在 server-side 計算的百分位數都是預估的。
TL; DR
-
假設設定一個 histogram,其中 buckets 是分成:
0 - 100ms ({le="0.1"})100 - 200ms ({le="0.2"})200 - 300ms ({le="0.3"})300 - 450ms ({le="0.45"})
-
下面以上述的設定舉幾個範例說明:
- 假設大部份的 request durations 都在 220ms,幾乎所有觀察結果甚至是第 95 百分位數都會落在標著
{le="0.3"}的 bucket,也就是 200ms 到 300ms 的區間。Histogram 的實作保證真實的第 95 百分位數會在 200ms - 300ms 的某個地方,但為了回傳單一數值而不是整個區間,Prometheus 會做線性內插,以上面的例子會回傳 295ms,而事實上第 95 百分位數是 220ms,這可能會讓你誤會。 - 假設 backend 現在要固定多花 100ms 處理,現在所有 request duration 會落在 320ms,而第 95 百分位數根據計算會是 442.5ms,雖然真正的值是 320ms。雖然事實上你只超出了你的 SLA 一點點,但根據計算的結果看起來卻是非常糟。
- 假設大部份的 request durations 都在 220ms,幾乎所有觀察結果甚至是第 95 百分位數都會落在標著
-
Summary 在這方面倒是沒有計算問題,但如果你需要 aggregate 數個 instances 的觀察結果,就沒辦法了使用 summary 了。
-
如果你 bucket 的邊界選的夠好,即使像上面那種不自然的分佈也可以分計算出真實的百分位數。
-
假設我們的 request durations 分佈是 90% 落在 150ms,剩下 10% 平均的分佈在 150ms - 450ms 之間,這時候第 95 百分位數正好是 300ms。
-
Summary 的百分位數會給定一個誤差值,例如我們可能會設定 0.95±0.01,然後這時候你得到的結果會是第 94 至 第 96 百分位數的結果,這可能無法讓你很清楚的判斷是否符合 SLA。
Alerting
-
總結:
- 保持 alert 簡單
- 對症狀 alert
- 有個好的 consoles 去找出 root causes
- 如果無法做什麼應對,避免找人救火
- Alert 會影響 end-user 的東西
TL; DR
Online serving systems
- 對高 latency 及 error rate 升高時發出 alert。
- 只要 user 的 latency 還沒有很高,就不需要發出 page。
- 只對 user 看的到的 error 發出 page。
- 如果有些是 user 看不到,但非常嚴重 (像是你的錢正不斷損失) 也可以發出 page。
Offline processing
- 檢查資料通過系統需要多久時間,當足夠影響 user 時就發出 page。
Batch jobs
- 當最近的 batch job 都沒有成功,而且會讓 user 看到問題,就發出 page。
- Threshold 可以設在跑兩輪 batch job 的時間,例如每 4 小時跑一次,跑一次 1 小時,10 小時就會是個合理的 threshold。
- 如果無法忍受任何一次的失敗,那應該更頻繁的執行 batch job,不應該有單一次失敗就需要人為介入調查。
Capacity
- 這不會馬上對 user 造成影響,所以通常需要人為介入調查,來避免近期的未來將資源用光。
Metamonitoring
- 確保監控基礎建設是正常運作的,所以 eat your own dog food。
- 針對症狀發出 alert 而不是 root cause,這可以減少 noise。
When to Use The Pushgateway
- 建議只在特定幾種情形下使用 Pushgateway,底下列出使用 Pushgateway 的缺點:
- 當有多個 instances 是透過 Pushgateway 時,Pushgateway 就變成單點且可能是瓶頸。
- 喪失 Prometheus 自動 healthy checking 的機制,在每次抓取會更新 up metric 的狀態。
- Pushgateway 永遠不會丟掉已經收到的 time series,Pushgateway 會一直 expose 給 Prometheus 直接有人手動刪除他。
- 上述最後一點在有多個 instances 情況下更相關,多個 instances 的 metrics 會一直保留在 Pushgateway 裡,即使原本的 instance 已經改名或移除了。
- 對比 Prometheus 用抓取的方式監控,當有個 instance 消失,他的 metrics 也跟著自動消失。
- 通常只有 service-level 層級的 job 才會使用 Pushgateway,例如有個 job 不包含機器或 instance label,這會減少管理 Pushgateway 上面舊的 metrics 的負擔。
Comparison to Alternatives
vs. Graphite
- Prometheus offers a richer data model and query language
- If you watt a clustered solution that can hold historical data long term, Graphite may be a better choice
vs. InfluxDB
There are many similarities between the systems:
- labels
- data compression
- extensive integrations
- hooks
Where InfluxDB is better:
- If you’re doing event logging.
- Commercial option offers clustering for InfluxDB, which is also better for long term data storage.
- Eventually consistent view of data between replicas.
Where Prometheus is better:
- If you’re primarily doing metrics.
- More powerful query language, alerting, and notification functionality.
- Higher availability and uptime for graphing and alerting.
vs. OpenTSDB
- Prometheus offers a richer data model and query language
vs. Nagios
- Nagios is suitable for basic monitoring of small and/or static systems there blackbox probing is sufficient
FAQ
What Dose Prometheus Fit and Not
Fit
- For recording any purely numeric time series
- Support for multi-dimensional data
- Querying is a particular strength
- Designed for reliability
Not fit
- If you need 100% accuracy, such as for per-request billing
Can Prometheus be made highly available?
Yes, run identical Prometheus servers on two or more separate machines. Identical alerts will be deduplicated by the Alertmanager.
For high availability of the Alertmanager, you can run multiple instances in a Mesh cluster and configure the Prometheus servers to send notifications to each of them.
How to feed logs into Prometheus?
-
Short answer: Don’t! Use something like the ELK stack instead.
-
Longer answer: Prometheus is a system to collect and process metrics, not an event logging system. The Raintank blog post Logs and Metrics and Graphs, Oh My! provides more details about the differences between logs and metrics.
If you want to extract Prometheus metrics from application logs, Google’s mtail might be helpful.
Can I send alerts
Yes, with the Alertmanager.
Currently, the following external systems are supported:
Can I monitor machines?
Yes, the Node Exporter exposes an extensive set of machine-level metrics on Linux and other Unix systems such as CPU usage, memory, disk utilization, filesystem fullness, and network bandwidth.
Can I monitor network devices?
Yes, the SNMP Exporter allows monitoring of devices that support SNMP.
Can I monitor batch jobs?
Yes, using the Pushgateway. See also the best practices for monitoring batch jobs.
Can I monitor JVM applications via JMX?
Yes, for applications that you cannot instrument directly with the Java client, you can use the JMX Exporter either standalone or as a Java Agent.
Useful Link
- Prometheus official documents
- Brief Introduction
- Prometheus中动态发现Target和Relabel的应用
- 规划 Prometheus 的存储用量
- Prometheus 实战
- 如何查询Prometheus在Ubuntu 14.04第1部分
- 如何查询Prometheus在Ubuntu 14.04第2部分
- Alertmanager routing tree editor
- Prometheus Alerting Flow
- Prometheus: understanding the delays on alerting
- What’s the difference between group_interval, group_wait, and repeat_interval?
- PromQL Deep Dive - The Prometheus Query Language
- Routing tree editor